
Instagram Insights is a powerful analytics tool that provides valuable insights into your Instagram account. Whether you’re an influencer, business, or professional, understanding what Instagram Insights is and how to use it can help you better understand your audience, grow your following, and improve your overall presence on the platform.
In this guide, we’ll walk you through everything you need to know about Instagram Insights, including:
What is Instagram Insights?
Instagram Insights is a native analytics tool that provides insights into your account. It’s available to all business and Creator accounts on Instagram. Using this tool can help you analyze your engagement data and find ways to improve your marketing strategy.
Step 1: Insights Basics
First things first, let’s quickly go over some of the basics of Instagram Insights. In order to use Insights, you must have a business or creator account. If you don’t have a business or creator account, you can convert your personal account to a business account in just a few steps.
What is an Instagram Business Account?
A business account is a free account type that allows businesses and creators to access features such as Insights and promoted posts. Business accounts also make it easier for people to contact you and learn more about your products or services.
What is an Instagram Creator Account?
Creator accounts are similar to business accounts, but they’re designed specifically for content creators. This account type gives creators access to features that help them measure their growth, understand their audience, and monetize their content.
How to Access Instagram Insights
There are three ways to see your Insights data:
Accessing Insights from Business or Creator Dashboard
After logging in, look in the upper right corner for a bar graph icon. This is your Insights Dashboard. Click on the bar graph icon to open up your Insights Dashboard. From here, you can view insights for all of your posts and Stories, as well as compare your data to other time periods.
Accessing Insights from a Post
You can also access insights for individual posts by going to the post itself and clicking on the tilted arrow icon in the upper right corner. This will open up a pop-up window with insights for that specific post.
Accessing Insights from a Story
To see insights for a particular story, swipe up the post and click on the vertical bar icon. Remember that analytics data from Stories is only available for 14 days after the story has been posted.
Now that you know how to access your Insights data, let’s take a look at what kind of information you can learn from it.
What Data is Included in Insights?
The data included in Insights comes from a variety of sources, including:
- Impressions – The number of times your posts have been seen.
- Reach – The number of unique people who have seen your posts.
- Website clicks – The number of times people have clicked on a link to your website from your profile or a post.
- Profile visits – The number of times people have visited your profile.
- Mentions – The number of times you’ve been mentioned in a post or Story.
- Track calls and emails – The number of times people have used the “contact” button on your profile to call or email you.
- Taps back – The number of times people have viewed your story and then tapped back to return to the previous Story.
- Taps forward – The number of times people have viewed your story and then tapped forward to advance to the next Story.
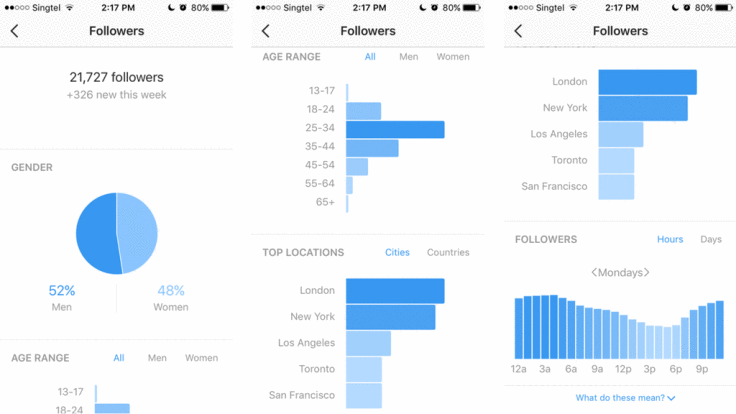
- Audience demographics – The gender, language settings, age, and location of your followers, including your top locations.
- Replies – The number of times people have replied to your story.
- Top follow days and hours – The days and hours when your followers are most active on Instagram.
- Exits – The number of times people have exited your story before it’s over.
If you’re not sure what some of these metrics mean, don’t worry! We’ll explain them in more detail later on.
What Should I learn on Instagram Insights?
There’s a lot of data included in Insights, which can be overwhelming at first. But don’t worry, we’ll help you make sense of it all.
Here are some of the key things you should ask yourself when analyzing your account’s performance:
- Growth – How is your following growing over time? Are you gaining or losing followers?
- Impressions – How many people are seeing your posts?
- Reach – How many unique people are seeing your posts?
- Website clicks – How many people are clicking on links to your website from your profile or posts?
- Profile visits – How many people are visiting your profile?
- Mentions – How often are you being mentioned in posts or Stories?
- Taps back/Taps forward – Are people engaging with your Stories? Are they tapping back to view previous Stories or tapping forward to advance to the next Story?
- Replies – Are people replying to your Stories?
- Exits – Are people exiting your Stories before they’re over?
This is just a small sampling of the data you can learn from Insights. Experiment with the different features and options to see what else you can discover!
Here are a few other things to keep in mind as you’re learning how to read Insights data:
- Compare your data to past performance to see if there are any trends or patterns.
- Use Insights to track your progress over time and set goals for future growth.
- Keep in mind that some data (such as website clicks) will be more relevant to certain businesses than others. Not all metrics will be equally important for every account.
What is the Most Important Insight on Instagram?
Now that we’ve gone over some of the basics, let’s talk about what Insights can tell you about your overall performance on Instagram.
The most important metric to pay attention to is your engagement rate. This is the percentage of people who see your posts and take some kind of action, such as liking, commenting, or sharing.
Engagement rates vary depending on the type of content you’re posting and the audience you’re targeting. For example, a post from a business about a new product might have a lower engagement rate than a personal post from a friend. But as long as you’re consistently creating content that your audience enjoys, you’ll see your engagement rate slowly increase over time.
There are several other metrics that can give you insights into the success of your content, but engagement rate is the most important one to focus on.
To help boost your engagement rate organically, you can buy active Instagram followers from a company like Skweezer. By doing this, you will see an increase in your engagement rate which will result in more people seeing your content and taking action on it.
Above all else, remember that not all engagement actions are equal. After all, it doesn’t take much investment from the user to like a post. On the other hand, leaving a comment requires more time and effort. So, while likes are still valuable, you should also pay attention to other forms of engagement, such as comments and website clicks.
Step 2: Familiarizing Yourself with IG Insights Dashboard
At first, the IG Insights dashboard may seem a little daunting. But don’t worry, we’ll walk you through each section so you know what all the different data points mean.
Find Individual Post Data
To find individual post data, go to your post and select the “View Insights” button and you’ll be taken to a page that shows you all the data for that specific post. You will be able to view basic metrics such as comments, likes, and saves, shown at the top.
“Actions” data shows you how many people have taken a specific action on your post, such as clicking on a link, following you, or viewing your profile.
“Discovery” data shows you how people found your post, such as:
- Explore – How many people found your post on the Explore page.
- Hashtag – How many people found your post through a hashtag search.
- Home – How many people found your post in their home page feed.
- Location – How many people found your post in their location feed.
- Search – How many people found your post through search.
- Others – Show various other types of engagement metrics such as how many people tagged, mentioned, saved your post, or shared it through DM.
Viewing Metrics for Multiple Posts at Once
You can also view data for multiple posts at the same time by selecting the “Posts” tab from your Insights dashboard according to the Instagram Support. This will show you a list of all your posts, along with their corresponding engagement metrics.
You can use the “Filter” option to narrow down the list of posts by date range, post type, or engagement metric.
For example, you could filter the posts to only show those from the last week that received over 100 likes. Or, you could filter by video posts and see which ones had the most views.
This is a great way to quickly see which types of content are performing well and which ones need some improvement.
Step 3: Analyzing Insights Data
Now we get into the fun part: analyzing all the data! Once you get the basics down, all of the percentages and numbers will start to make sense and you’ll be able to glean valuable insights from them.
How Do I Analyze My Instagram Account?
First, you need the right mindset. You’re going to be dealing with a lot of information, so it’s important to go into the analysis with a clear goal in mind.
For example, let’s say you want to increase your website clicks. In that case, you would want to look at all of your posts and see which ones have generated the most website clicks. Once you identify those posts, you can take a closer look at what made them successful and try to replicate that in future posts.
On the other hand, if you’re just looking to get a general idea of how your account is performing, you can take a look at your overall engagement rate. This number will give you a good indication of how popular your content is and whether or not people are actually interacting with it.
If you’re just curious about how far your reach is, you can take a look at your impressions. This number represents the total number of times your content has been seen, regardless of whether or not people have engaged with it. But, be advised there is a difference between your reach and impressions stats.
What is the Difference Between Reach and Impressions?
Your “reach” is the number of unique people who have seen your content. So, if the same person sees your content multiple times, they will only be counted once.
On the other hand, your “impressions” represents the total number of times your content has been seen, even if it’s by the same person multiple times.
For example, let’s say you have a post with 100 views and 50 unique viewers. In that case, your reach would be 50 and your impressions would be 100.
Generally speaking, you want your reach to be as high as possible. But, depending on your goals, you may also want to pay attention to your impressions.
What’s a Good Engagement Rate on Instagram?
Engagement rate is probably the most important metric to pay attention to, especially if you’re looking to increase your following. This number represents the percentage of people who saw your content and actually interacted with it in some way.
The formula for engagement rate is:
Engagement rate = (Total number of engagements) / (Total number of impressions) * 100%
For example, let’s say you have a post with 1,000 views and 100 likes. In that case, your engagement rate would be 10%.
Keep in mind that the engagement rate will vary depending on the number of followers you have. For example, a post with 100 likes from an account with 10,000 followers will have a much higher engagement rate than a post with the same number of likes from an account with 1 million followers. As your follower count fluctuates over time, so will your engagement rate.
That being said, a good engagement rate is usually around 1-3%. Of course, the higher the better. But, don’t freak out if your number is a little lower than that. You can easily boost your engagement rate with a simple automated Instagram engagement tool like Skweezer.
With Skweezer, you can increase your engagement rate to help you reach more people and grow your Instagram account organically.
What Happens if I Don’t Analyze My Stats?
Not analyzing your stats is like flying blind. You might think you’re doing everything right, but unless you’re looking at the numbers, you really have no idea.
For example, let’s say you’re trying to increase your website clicks. But, without looking at your stats, you have no way of knowing which of your posts are actually generating clicks. As a result, you could be wasting time and effort on content that no one is interested in.
Worse yet, you may actively work to harm your marketing efforts both directly and indirectly in ways like:
- Fewer conversions from ads or post CTAs.
- Missing prime engagement opportunities by posting on the wrong day or time.
- Low ROI from influencer marketing because you picked the wrong influencers.
- Missing your target audience.
- Stunted engagement and reach from using the wrong hashtags.
- Diminished impressions and reach for your posts.
On the other hand, if you’re consistently analyzing your stats, you can quickly identify which content is working and which isn’t. This way, you can focus your efforts on the content that is actually helping you reach your goals.
In short, analyzing your stats is essential if you want to grow your Instagram account. Not only will it help you identify which content is performing well, but it will also help you figure out where you need to improve. So, don’t forget to check your stats on a regular basis!
Related: 5 Tips To Make Good Instagram Posts
IG Insights FAQ
To bring this guide to a close, let’s answer some frequently asked questions about Instagram Insights.
How Often are Instagram Insights Updated?
Your insights will be updated every 24 hours. So, if you want to stay on top of your stats, make sure to check back in at least once a day.
Does Instagram Insights Show Who Views Your Profile?
No, Instagram does not currently offer a feature that allows you to see who has viewed your profile.
What Does the Paper Plane Mean on Instagram Insights?
The paper plane icon represents the number of times your content has been shared. So, if someone shares one of your posts to their story or sends it to a friend, it will be counted as a share.
What is the Arrow on Insights?
The arrow represents the number of times your content has been sent to someone else as a direct message.
What’s Next?
Now that you know everything there is to know about Instagram insights, it’s time to put that knowledge to good use. Start by taking a look at your stats and see which areas you need to improve. Then, take some time to experiment with different types of content and see what gets the best results.
To really turn your engagement up a notch, be sure to try Skweezer. With Skweezer, you can get more likes, comments, and views on your content. Paid engagement is the best way to boost your stats and reach more people. So, what are you waiting for? Try Skweezer today!